Close

Explore NYC’s building data

Learn more about NYC’s buildings and how much energy they use.

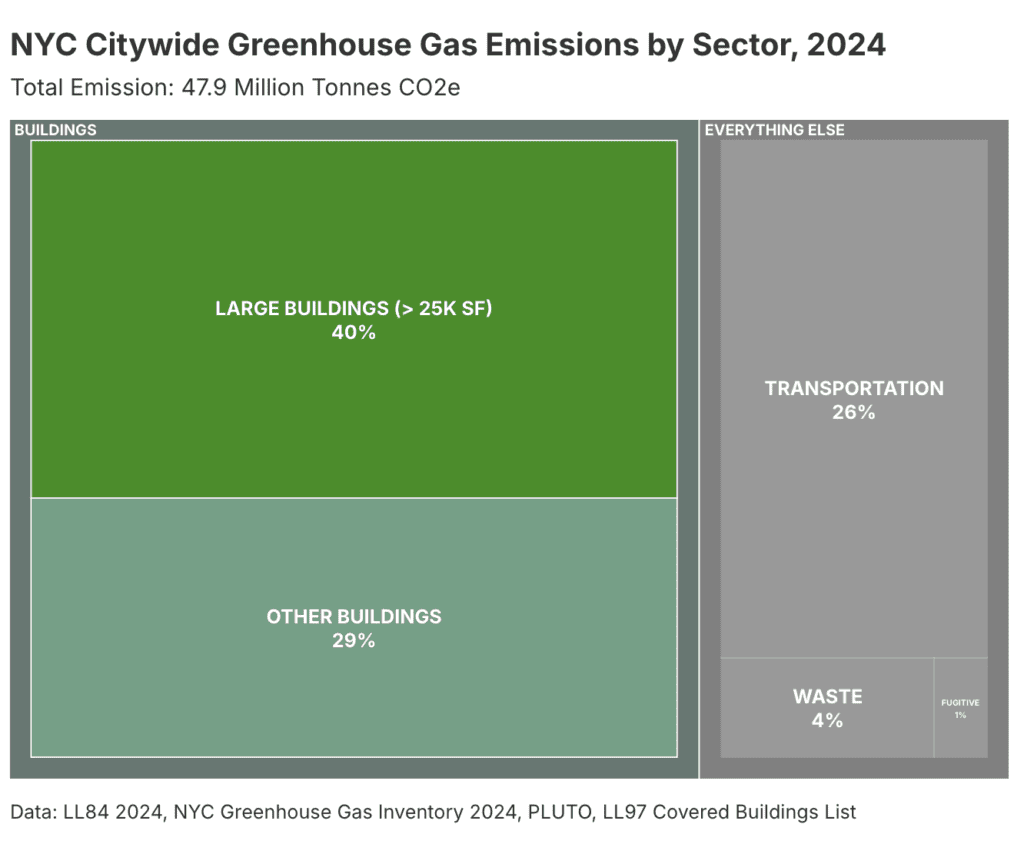
Addressing climate change means addressing energy use in buildings. More than two-thirds of New York City’s greenhouse gas emissions come from this sector. Reliable data on building energy use is essential to creating effective policies to reduce emissions and track our progress.

In 2010, New York became one of the first American cities to collect data about the energy and water used by large buildings. This data—referred to as benchmarking data—is released every year for most buildings over 25,000 square feet in NYC, and allows us to analyze how buildings are using energy today along with changes over time. NYC’s benchmarking dataset is the largest and most comprehensive in the country, and the city has successfully leveraged this data to implement innovative policies that promote energy efficiency and reduce emissions. 

In 2021—the latest year of benchmarking data available—total emissions from large buildings have fallen 24 percent since benchmarking began in 2010. Emissions in 2021 actually increased from 2020, largely because the closure of the Indian Point nuclear power plant resulted in more gas combustion to generate NYC’s electricity. The 2021 building energy data also continues to show significant impacts from the changes to building occupancy caused by the COVID-19 pandemic, most notably reduced energy use in offices and hotels.

Explore the graphics on this page to learn more about the energy use and carbon footprint of NYC’s large buildings.

Carrier

Thank you, Carrier!

This interactive dashboard was made possible thanks to generous support from Carrier. See how Carrier is crafting innovative solutions and services to meet the most essential needs and biggest challenges.

More than a decade of data

2021

Most recent benchmarking data available

24%

Reduction in emissions from large buildings since 2010

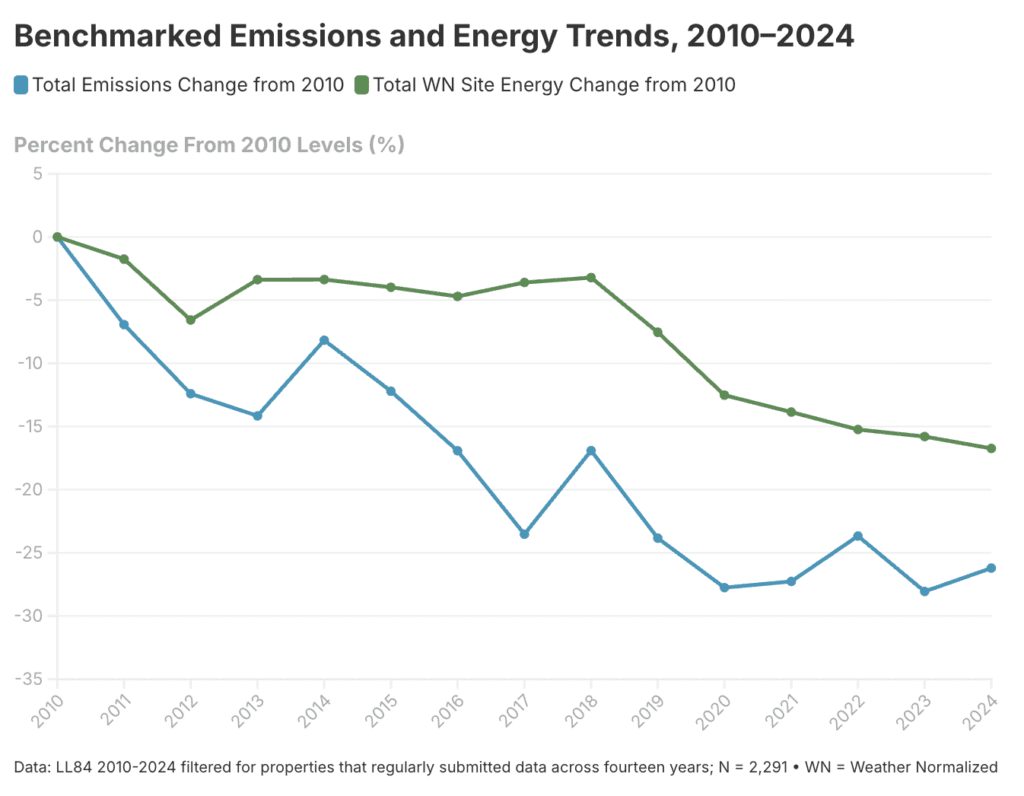
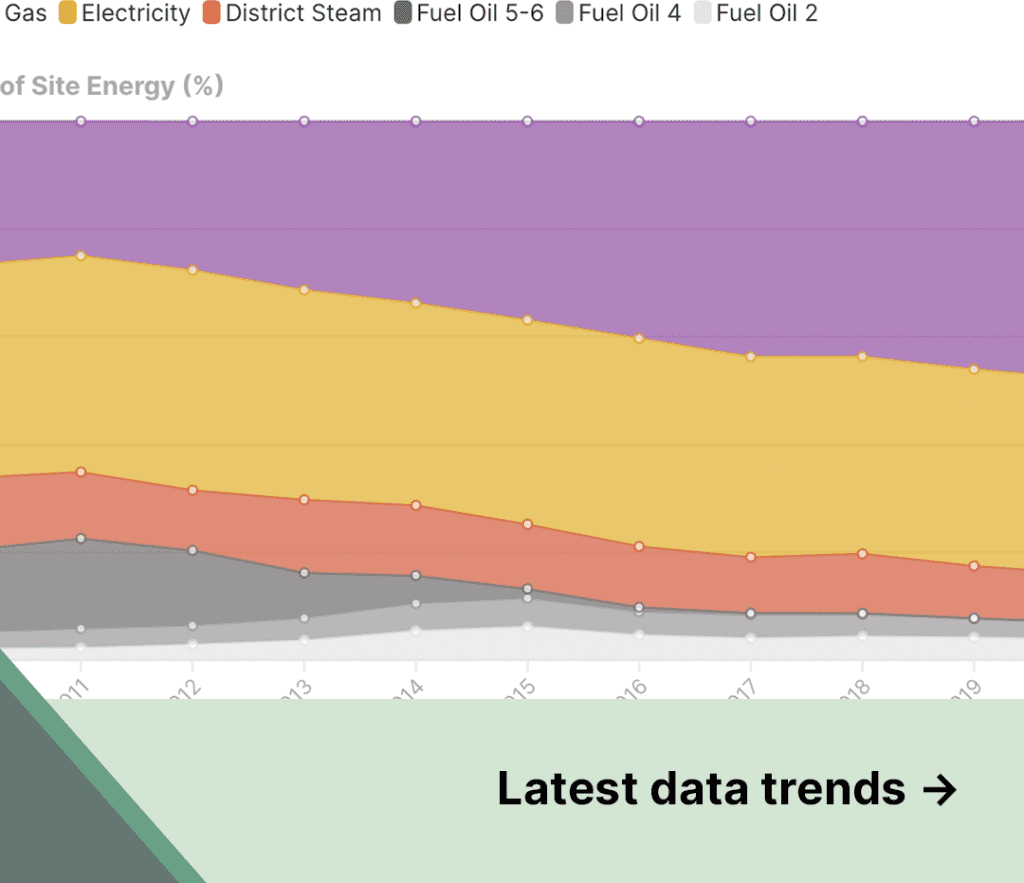
Energy use and carbon emissions from NYC’s largest buildings have fallen over the past 12 years. These metrics vary from year to year due to multiple factors, including the fuel mix for electricity generation and variable weather. However, they have both trended down due to more efficient energy use, improved district steam production and delivery, and accelerated fuel switching. 

Fuel switching—or changing the main energy source a building uses for heating and hot water—has been primarily defined by gas replacing heavy fuel oil in most benchmarked buildings. Over the next few decades, buildings need to replace gas with clean electricity in order to meet our collective decarbonization goals.

How building characteristics affect energy use

Energy use is often reported in energy-use intensity (EUI), the amount of energy used per area. The median value—with half the data points lying above it and half below—is most useful in describing how buildings compare to their peers.

Legend

Size
Midsize: 25-50k SF
Large: 50-500k SF
Very large: 500k+ SF

Height
Low-rise: ≤ 7 floors
High-rise: > 7 floors

Age
Pre- & Post-War: Before 1980
Pre-Energy Code: 1980-2011
Energy Code Era: After 2011

Using data to track policy progress

State and local laws will need to encourage both energy efficiency at the building level and decarbonization at the utility level for us to achieve our low-carbon goals. Two new laws aimed at ramping up efficiency were enabled by benchmarking data. 

Local Law 97 places carbon caps on thousands of residential and commercial properties across NYC. The graphs below show how covered buildings’ current energy use relates to the law’s first two emissions limits in 2024 and 2030. Both figures can display 2019 and 2021 benchmarking data. With the pandemic still affecting building energy use, the 2019 data is more consistent with full building occupancy. But it is likely that some pandemic-induced changes to how and when we use energy in buildings will become the norm moving forward.


NYC’s Building Energy Grade Law seeks to boost energy efficiency efforts by making all New Yorkers aware of differences in building energy use. Buildings receive a Building Energy Efficiency Rating every year based on their ENERGY STAR score, which is an EPA program that ranks the energy performance of buildings by comparing them to similar buildings with the same primary use nationwide.