The NYC office is back, but energy use isn’t
Published by Urban Green Council • August 6, 2025
In 2020, energy and water use across New York City shifted significantly. Offices emptied, remote work became the norm, and daily routines changed overnight. In our previous report on COVID-era energy and water use, we investigated how more time at home, less time in offices, and significant population shifts led to large drops in energy use citywide, revealing emerging differences between commercial and residential markets.
Now, with three additional years of data, we took a fresh look at how building energy use has evolved. We found that citywide energy use remains well below pre-pandemic levels, but that trends in the office and residential markets have diverged sharply. These results suggest that the pandemic triggered lasting changes in how energy is used in NYC buildings.
So what’s changed—and what hasn’t? In this analysis, we examine whether trends that emerged during the pandemic have gone back to how they were pre-pandemic or solidified into a new normal. From office occupancy to residential energy use, the data shows how NYC buildings continue to adapt.
Are office workers still working from home?
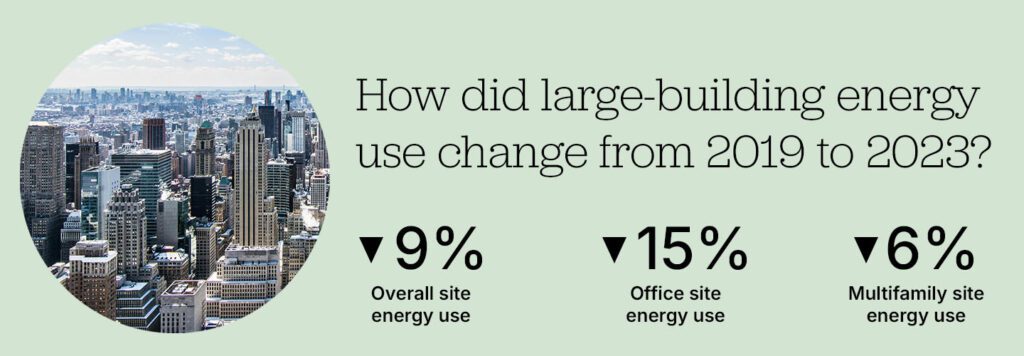
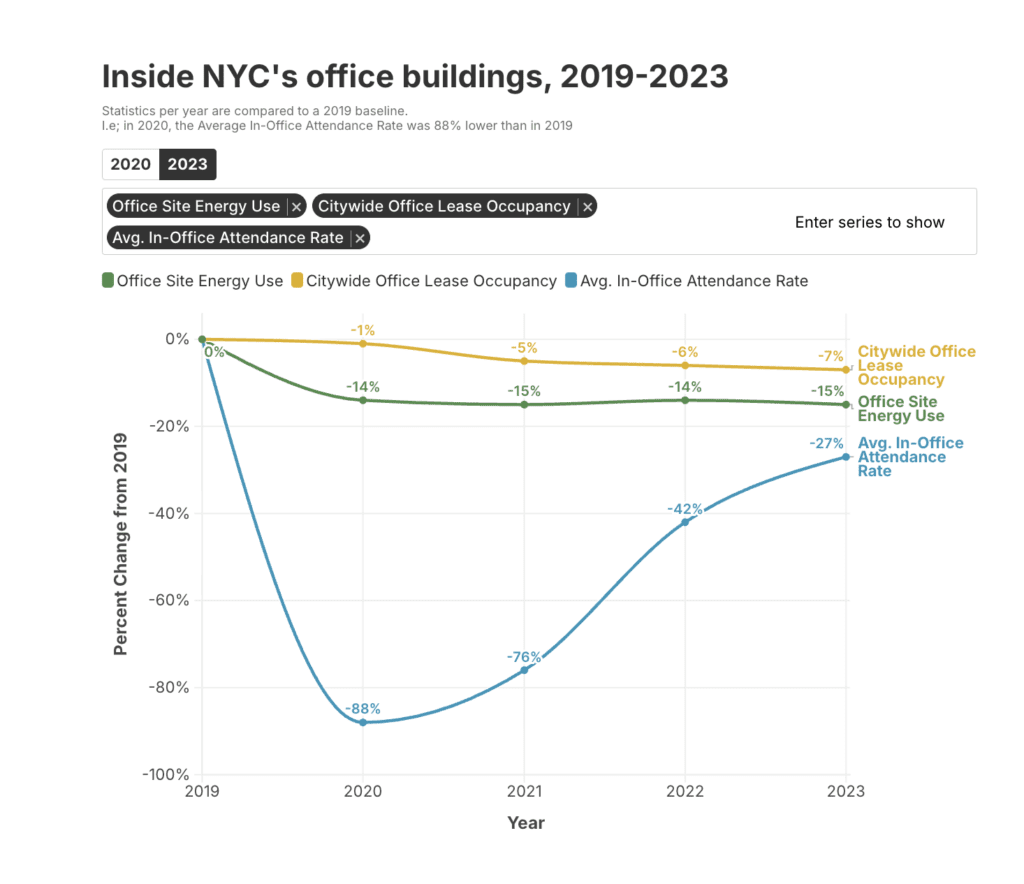
In 2023, site energy use1Data sources from 2019-2023 LL84 Benchmarking Data; energy statistics are weather normalized (WN) in office buildings was 15 percent lower than in 2019, with little fluctuation in the years since 2020. Between 2019 and 2020, site energy use in NYC’s offices saw a sharp decline, dropping by 14 percent. The four years of sustained, lower energy use suggest a new baseline for office energy use has emerged.
This is surprising, given that many workers have returned to the office in the past few years. 57 percent of workers were in-office on an average weekday in August 2024, up from just 8 percent of workers on an average weekday in August 2020, according to the Partnership for NYC’s Return-to-Office Surveys.2https://pfnyc.org/research/return-to-office-survey-results-march-2025/
We also heard from building owners that midweek worker occupancy has largely recovered to normal, but gaps still exist—Mondays and Fridays are noticeably lower than pre-pandemic.3Real estate industry market intelligence
One likely factor is decreased lease occupancy—a measure of office space vacancy in the city. Lease occupancy has slowly been dropping year-over-year as long-term office leases expire and are not renewed.4https://comptroller.nyc.gov/reports/spotlight-new-york-citys-office-market/
While normally this could imply a weak market, we also know that NYC’s job market and economy is not only healthy, but in fact doing better than it was before COVID-19: NYC’s “Gross City Product” (essentially localized GDP) was at an all-time high in 2023.5https://edc.nyc/sites/default/files/2025-01/NYCEDC-State-of-the-NYC-Economy-2024-v3.pdf Economic activity is high, but more of it is happening outside the office.
Figure 2
These trends paint a complex picture, with several factors likely driving this new energy use plateau:
- Smarter operations: Modified or shortened hours of operation reducing energy usage; for example, many building owners now shut off building systems overnight (a rarity pre-COVID).
- Energy Efficiency Upgrades: Many buildings completed long-overdue commercial energy efficiency upgrades during the pandemic to take advantage of lowered occupancy, leading to less overall energy use.
- More vacancy: There are twice as many vacant offices as in 2019, counterbalancing energy use increases since the return to in-office work.
Residential Energy: A break between boroughs
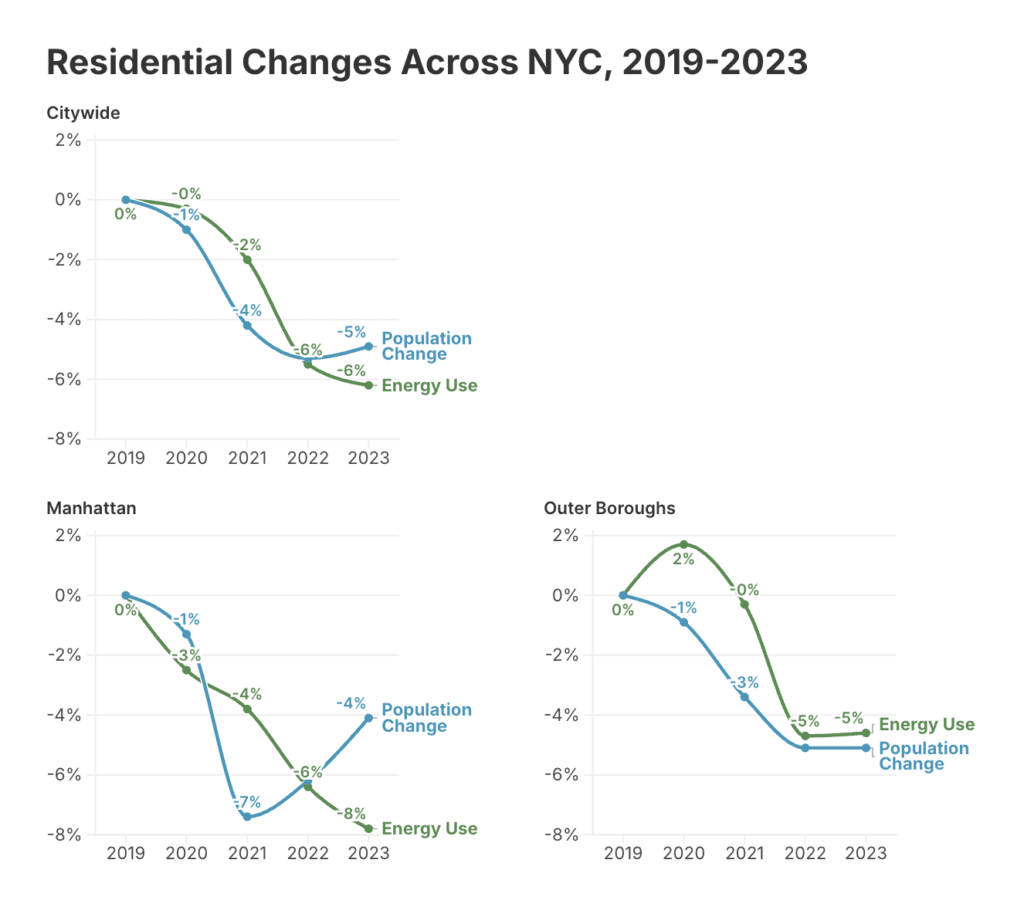
Since 2019, residential energy use in NYC has declined by 6 percent. This decline differs across neighborhoods, but two factors play a major role in driving this trend: population loss and improved energy efficiency.
Population loss has the most obvious effect on energy use. Between 2019 and 2023, the city lost 5 percent of its total population.6https://s-media.nyc.gov/agencies/dcp/assets/files/pdf/data-tools/population/population-estimates/current-population-estimates-march-2025-release.pdf With fewer residents, a 6 percent drop in residential energy use does not seem surprising.
In the outer boroughs, this pattern holds. The Bronx saw a 7 percent decrease in population between the start of the pandemic and 2023, with a comparable 5 percent decrease in residential energy use during that time period. Brooklyn and Queens each lost at least 4 percent of their population from the start of the pandemic.
Unlike the rest of the city, Manhattan has followed a noticeably different population and energy use trend post-COVID than the rest of the boroughs.
While the other boroughs lost population slowly over time—beginning during COVID and accelerating to the present—Manhattan lost 7 percent of its population between July 2019 to July 2021, but gained some of it back, and by 2023 was down only 4 percent. Energy usage in the outer boroughs peaked during the pandemic and has since dropped to below 2019 levels. Manhattan’s energy use dropped immediately in 2020 but has not increased since, despite a rebounding population.
Figure 3
Shrinking population largely explains lower overall energy use in the outer boroughs. In Manhattan, energy efficiency upgrades in large residential buildings could be contributing to the sustained reductions. While building energy use has continued to drop in Manhattan, water and electricity use in those same buildings has climbed in step with Manhattan’s rebounding population.
Let’s look at a specific community district to examine this trend closely. Community District (CD) #107 in the Upper West Side shows trends typical for most neighborhoods in Midtown and Lower Manhattan.
Figure 4
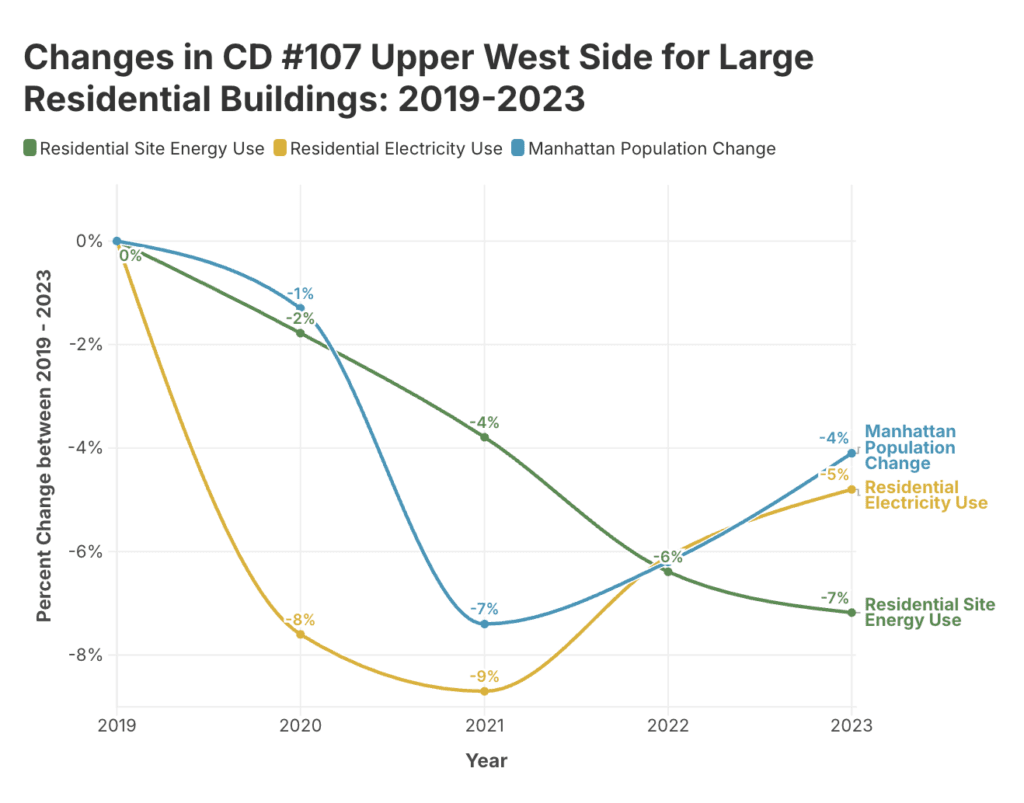
Electricity use in CD #107 has rebounded to above pandemic lows (with some fluctuations in between), but energy use has continuously decreased since 2019. Energy use includes electricity use, but also fossil fuel use—mostly gas and oil used for heating and domestic hot water. With overall energy use declining even as electricity use rises, increased efficiency in fossil fuel systems in Manhattan’s large residential buildings is the likely driver; for example, fuel oil to gas conversions or upgrades to steam heating systems.
Many neighborhoods in lower and midtown Manhattan follow similar trajectories as Community District #107, with declining energy use despite rising electricity and water demand
The outer borough neighborhoods are harder to draw clear conclusions from. Different neighborhoods across the boroughs have followed a wide range of post-COVID energy use trajectories that are not apparent when looking from the borough level. Many saw energy use spikes during COVID, and some have reverted to 2019 levels, while others have continued to increase.
Given the variance between neighborhoods in the outer boroughs and the lack of neighborhood-level population data, we can only point to borough-level population loss to explain any energy use declines.
What has the post-pandemic era meant for NYC buildings?
Overall, it’s clear that the shakeups COVID brought to NYC have led to lasting changes in energy use. From drastic changes in office occupancy and energy use to efficiency improvements in Manhattan residential buildings and large fluctuations in population—the pandemic reshaped how New Yorkers live, work and use energy. A “new normal” for some sectors of the city has emerged, but more time and data are needed to fully understand other evolving trends.
This data analysis is made possible with generous support from Carrier.
How a global pandemic shifted NYC’s energy use
NYC site energy use and carbon emissions both decreased in 2020.
5 years after Covid: Healthy building trends to know (w/ Dr. Joe Allen)
In a special fifth anniversary episode, Dr. Joe Allen discusses ways to improve indoor air quality and shares the healthy building trends you need to know.