NYC site energy use and CO2 emissions both decreased in 2020.
Published April 20, 2022
In March 2020, the onset of the coronavirus pandemic forced Urban Green to end in-person events, and our staff began working from home. Employers across the city and state adopted similar safety measures, dramatically changing the lives of New Yorkers. That pause in activity resulted in a massive drop in energy use and emissions citywide. The 2020 benchmarked energy and water use data from NYC’s large buildings detail these changes and their likely causes.
Specifically, changes to building occupancy—more time spent at home, less in the office, and significant migration out of certain NYC neighborhoods—drove most of the drop in energy use. Patterns in people’s movement can be difficult to track, so we used a variety of methods, like comparisons of water use, to estimate how many people were in these buildings. We found that occupancy changed in vastly different ways depending on building type and location.
Three trends stood out:
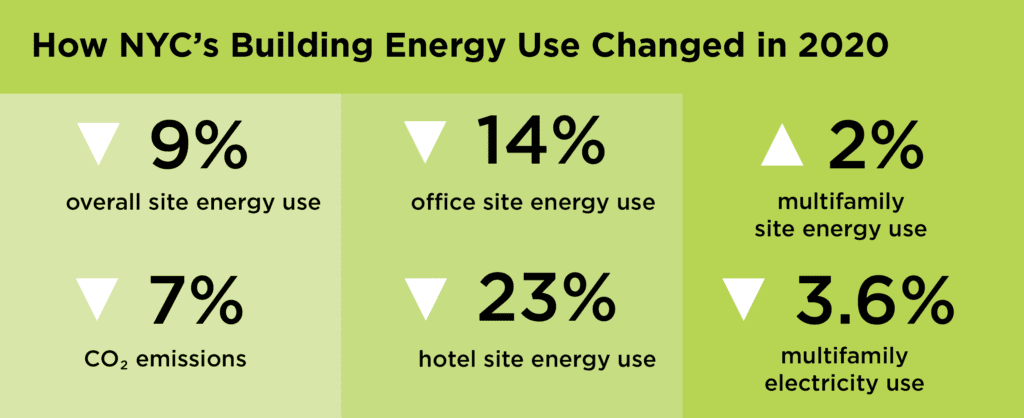
- NYC site energy dropped 9 percent but resulted in only a 7 percent emissions decline because the electricity buildings used got dirtier in 2020. Indian Point Energy Center’s Unit 2 was shut down in April 2020, and its roughly 7,500 MWh output of zero-carbon electricity was mostly replaced with gas-fired generation.1
- Occupancy and energy use fell in offices and hotels. Offices cut their site energy use by 14 percent in 2020 compared to 2019. That was far less than their decrease in occupancy.2 Hotel energy use dropped 23 percent.
- Multifamily buildings varied widely in occupancy and energy use depending on their location. Total multifamily site energy use was up 2 percent, mainly due to burning fossil fuels. Surprisingly, multifamily electricity use fell 3.6 percent in 2020, but Manhattan skewed that result since its use fell almost 8 percent while all other boroughs increased.
Figure 1
Work from home
Weekdays in Manhattan usually mean streams of people flowing from apartments to workplaces. But in 2020, many people stopped commuting and stayed home. Annual electricity use in offices citywide fell by 16 percent as many lights, computers and other appliances remained off.
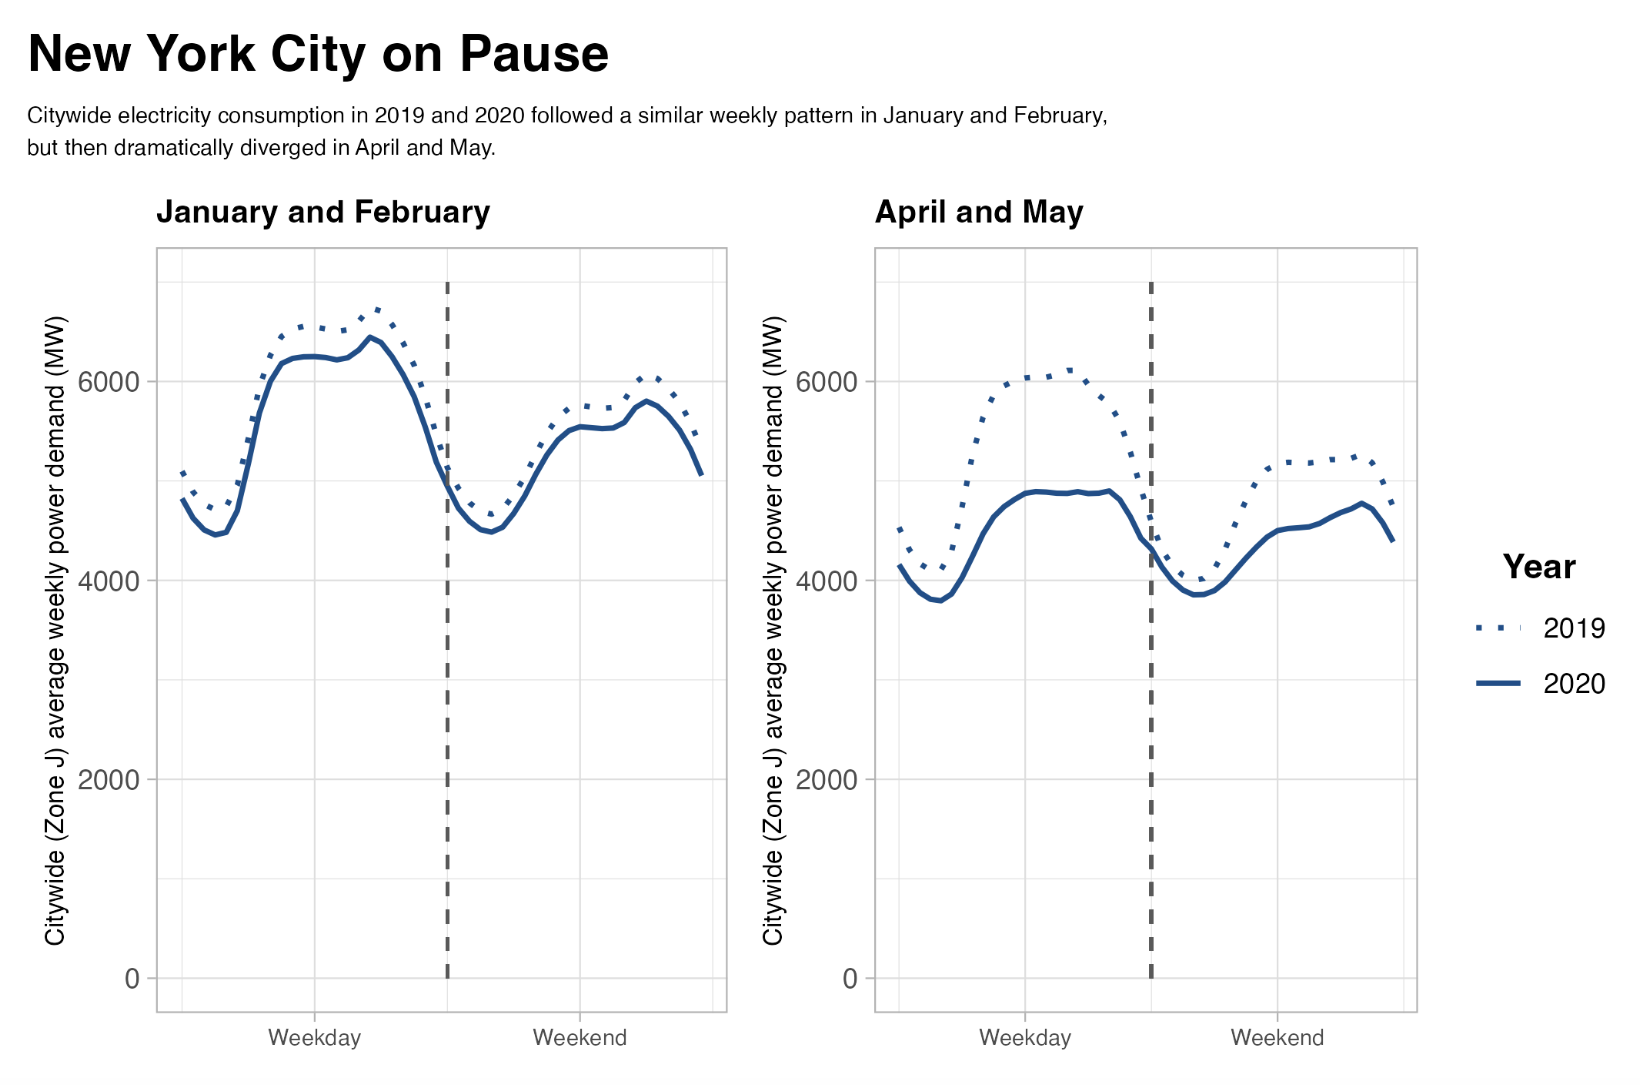
Electricity used citywide, for everything from trains to tea kettles, was down as well, but only by about 8 percent.3 The spring saw the biggest shift, as power demand fell by 1,000 MW, and demand patterns on weekdays and weekends started to align. Every day started to look the same in terms of energy use. Figure 2 compares electricity use in 2019 and 2020—demand in January and February was similar in each year, but much lower in April and May of 2020, when the first wave of the pandemic was in full swing across New York City.
Figure 2
Monthly benchmarking data also showed electricity use bottoming out in spring 2020. Figure 3 shows monthly changes in office occupancy and electricity use across NYC, and the impact of working from home is clear. Yet the drop in electricity use was not as deep as in occupancy, which was at least a 36 percent decline year over year based on water use. And occupancy in these buildings likely dropped more than that: aggregated and anonymized cell phone use patterns indicate Manhattan office occupancy was down approximately 60 percent from April 2019 (for more on this disparity, check out the recording of our public event on the ‘Great Energy Disconnect’).
Figure 3
Community by community
As a whole, NYC multifamily buildings behaved differently than the national trend. Whereas electricity use increased 2 percent in residential buildings across the US,4 total weather normalized electricity use in NYC’s multifamily buildings fell 3.6 percent in 2020 compared to 2019.
But that aggregated citywide decrease obscures some radical differences between neighborhoods. In Manhattan, electricity consumption decreased in multifamily housing by 7.8 percent—including double digit decreases in lower Manhattan. Figure 4 shows the opposite trend occurred in the outer boroughs. Multifamily electricity consumption increased by 0.4 percent in Queens, 1.1 percent in Brooklyn, 3.5 percent in the Bronx and 4.9 percent in Staten Island.
Figure 4
The simplest explanation for this divergence in electricity use is that the pandemic caused some New Yorkers to leave the city and others to spend more time in their apartments. Water use went up in many outer borough multifamily buildings, suggesting that more people were at home for longer periods of time.
The map below shows the change in electricity and water use between 2019 and 2020 by community district, which have boundaries that are designed to align closely with NYC neighborhoods. Many districts in the outer boroughs experienced both an increase in electricity and water use, while most community districts in Manhattan saw decreases in both. It’s likely fewer people lived in these buildings in 2020. The city comptroller's office recently reported that the wealthiest New Yorkers—those living in areas with median incomes over $110,000—were 4.6 times more likely to leave the city than everyone else.5
Figure 5
What did the pandemic teach us about NYC buildings?
The pandemic resulted in lowered energy use citywide, especially in commercial buildings. But remote work and high unemployment meant that many multifamily buildings used more electricity and gas. Some of the people who had the means to leave NYC did so, as eight of the 10 community districts with the highest decreases also had top-ten median incomes for NYC.6 Those who stayed faced higher utility bills, since electricity and gas use increased in areas with increased occupancy, and that exacerbated energy affordability issues for lower income New Yorkers.7
Energy Star Scores jumped across the city, especially in offices and hotels. These scores determine Building Energy Efficiency Rating letter grades, so by themselves, the building grades for 2020 make it seem like buildings performed better. But, upon closer inspection, not all offices and hotels are reporting the drop in occupancy, inadvertently inflating their scores and raising perceived energy performance citywide.
For example, just 15 percent of hotels earned an A or B in 2019, but that proportion more than doubled to 39 percent in 2020. These improvements are almost certainly the result of most hotels reporting occupancies inaccurately.8 Variability in these letter grades, and building emissions, could continue as the long-term effects of the pandemic and climate change reveal themselves.
Like most aspects of life in NYC, energy use in buildings changed significantly in 2020. Some of these trends, like reduced occupancy in office buildings, have already started to rebound, but it’s unclear if they will ever return to 2019 levels. Changes in electricity and water use due to increased work from home could be the new normal. It’s important that we continue to monitor these trends and integrate the insights into future building decarbonization strategies.
This analysis was made possible with support from Carrier.
Footnotes
1 “Three natural gas-fired power plants have been introduced over the past three years to help support the electric supply needed by New York City that Indian Point had been providing: Bayonne Energy Center II (120 MW), CPV Valley Energy Center (678 MW), and Cricket Valley Energy Center (1,020 MW).” https://www.eia.gov/todayinenergy/detail.php?id=47776
2 Comparing 2020 to 2019, water use in offices dropped 40 percent, hotel use fell 36 percent and K-12 schools 96 percent. We assume that the drop in water use represents the minimum occupancy drop in a building, since some water may still be used for base building operation. Google’s COVID-19 Community Mobility Reports (https://www.google.com/covid19/mobility/) data suggest that workplace occupancy was down more than 60 percent compared to pre-pandemic workdays in NYC.
3 Based on NYISO Zone J actual electricity use for 2019 and 2020. Weekday curves include data from Mondays, Tuesday, Wednesdays, Thursdays and Fridays, and weekend curves include data from Saturdays and Sundays.
4 EIA analysis of residential electricity use across the US: https://www.eia.gov/todayinenergy/detail.php?id=47976
5 “Residents in the wealthiest 10 percent of neighborhoods, corresponding to median incomes above $110,000, were 4.6 times more likely to leave than other residents during 2020…Such neighborhoods include Park Slope/Carroll Gardens in Brooklyn and Battery Park City/Greenwich Village, Murray Hill/Gramercy, Chelsea/Midtown, the Upper West Side, and the Upper East Side in Manhattan.” https://comptroller.nyc.gov/wp-content/uploads/documents/The-Pandemics-I...
6 https://comptroller.nyc.gov/reports/the-pandemics-impact-on-nyc-migratio...
7 “Electricity burden—the percentage of household income that goes toward electricity costs—increased by 4.7 percent for residential customers. Customers in the lowest income bracket were hardest hit, experiencing a 7 percent increase in electricity burden.” https://rmi.org/rmi-reality-check-covid-not-clean-energy-drove-rise-in-electricity-burden/
8 These inaccuracies are not intentional. Benchmarked occupancy data has never been well tracked or vetted since data collection began in 2010. Hotel occupancy averaged 90 percent in 2020 benchmarked data compared to 94 percent in 2019 benchmarked data.